INTERPRETING THE
2D H/H COSY SPECTRUM
It's already some 30 years since the bidimensional techniques revolutionized structural elucidation by NMR. The theory behind the recording of these spectra exceeds the goals of this course. We will however study their interpretation which is fortunately much easier.
The so-called 2D H/H COSY H/H, acronym of "bidimensional proton/proton COrrelation SpectroscopY", is the first kind of 2D NMR spectra we'll study right away.
Let's look to a simple but revealing example:
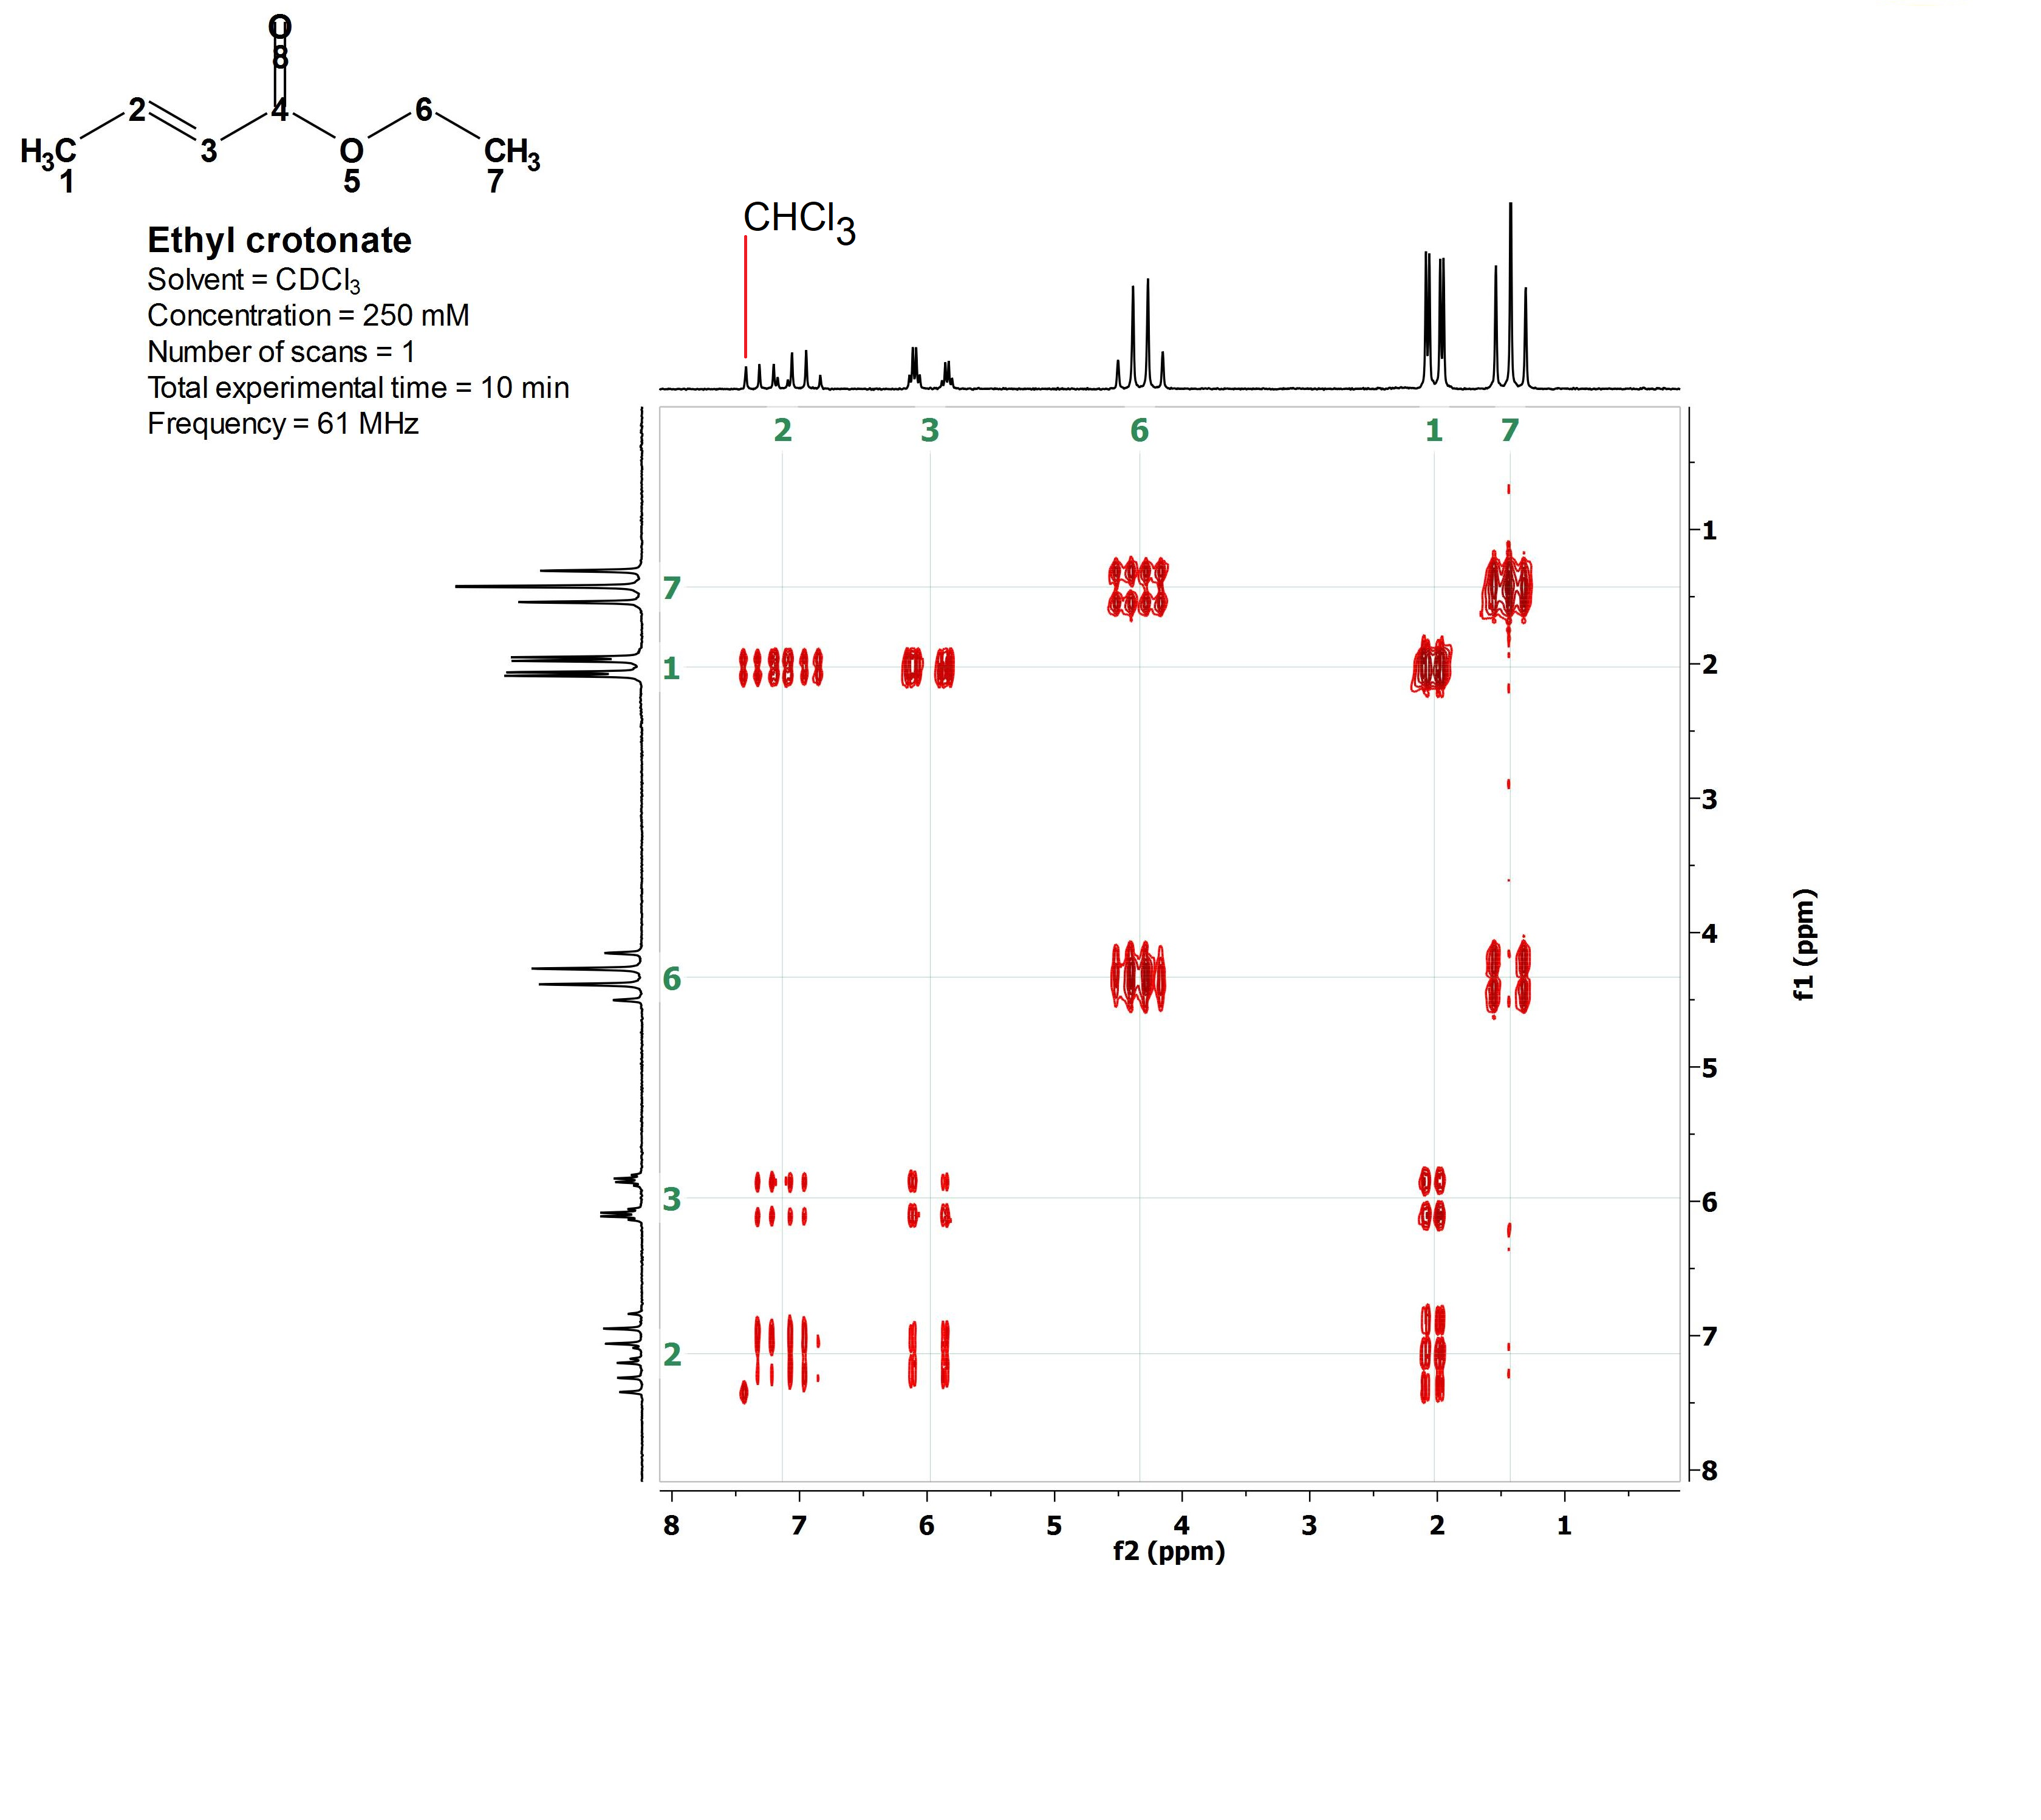
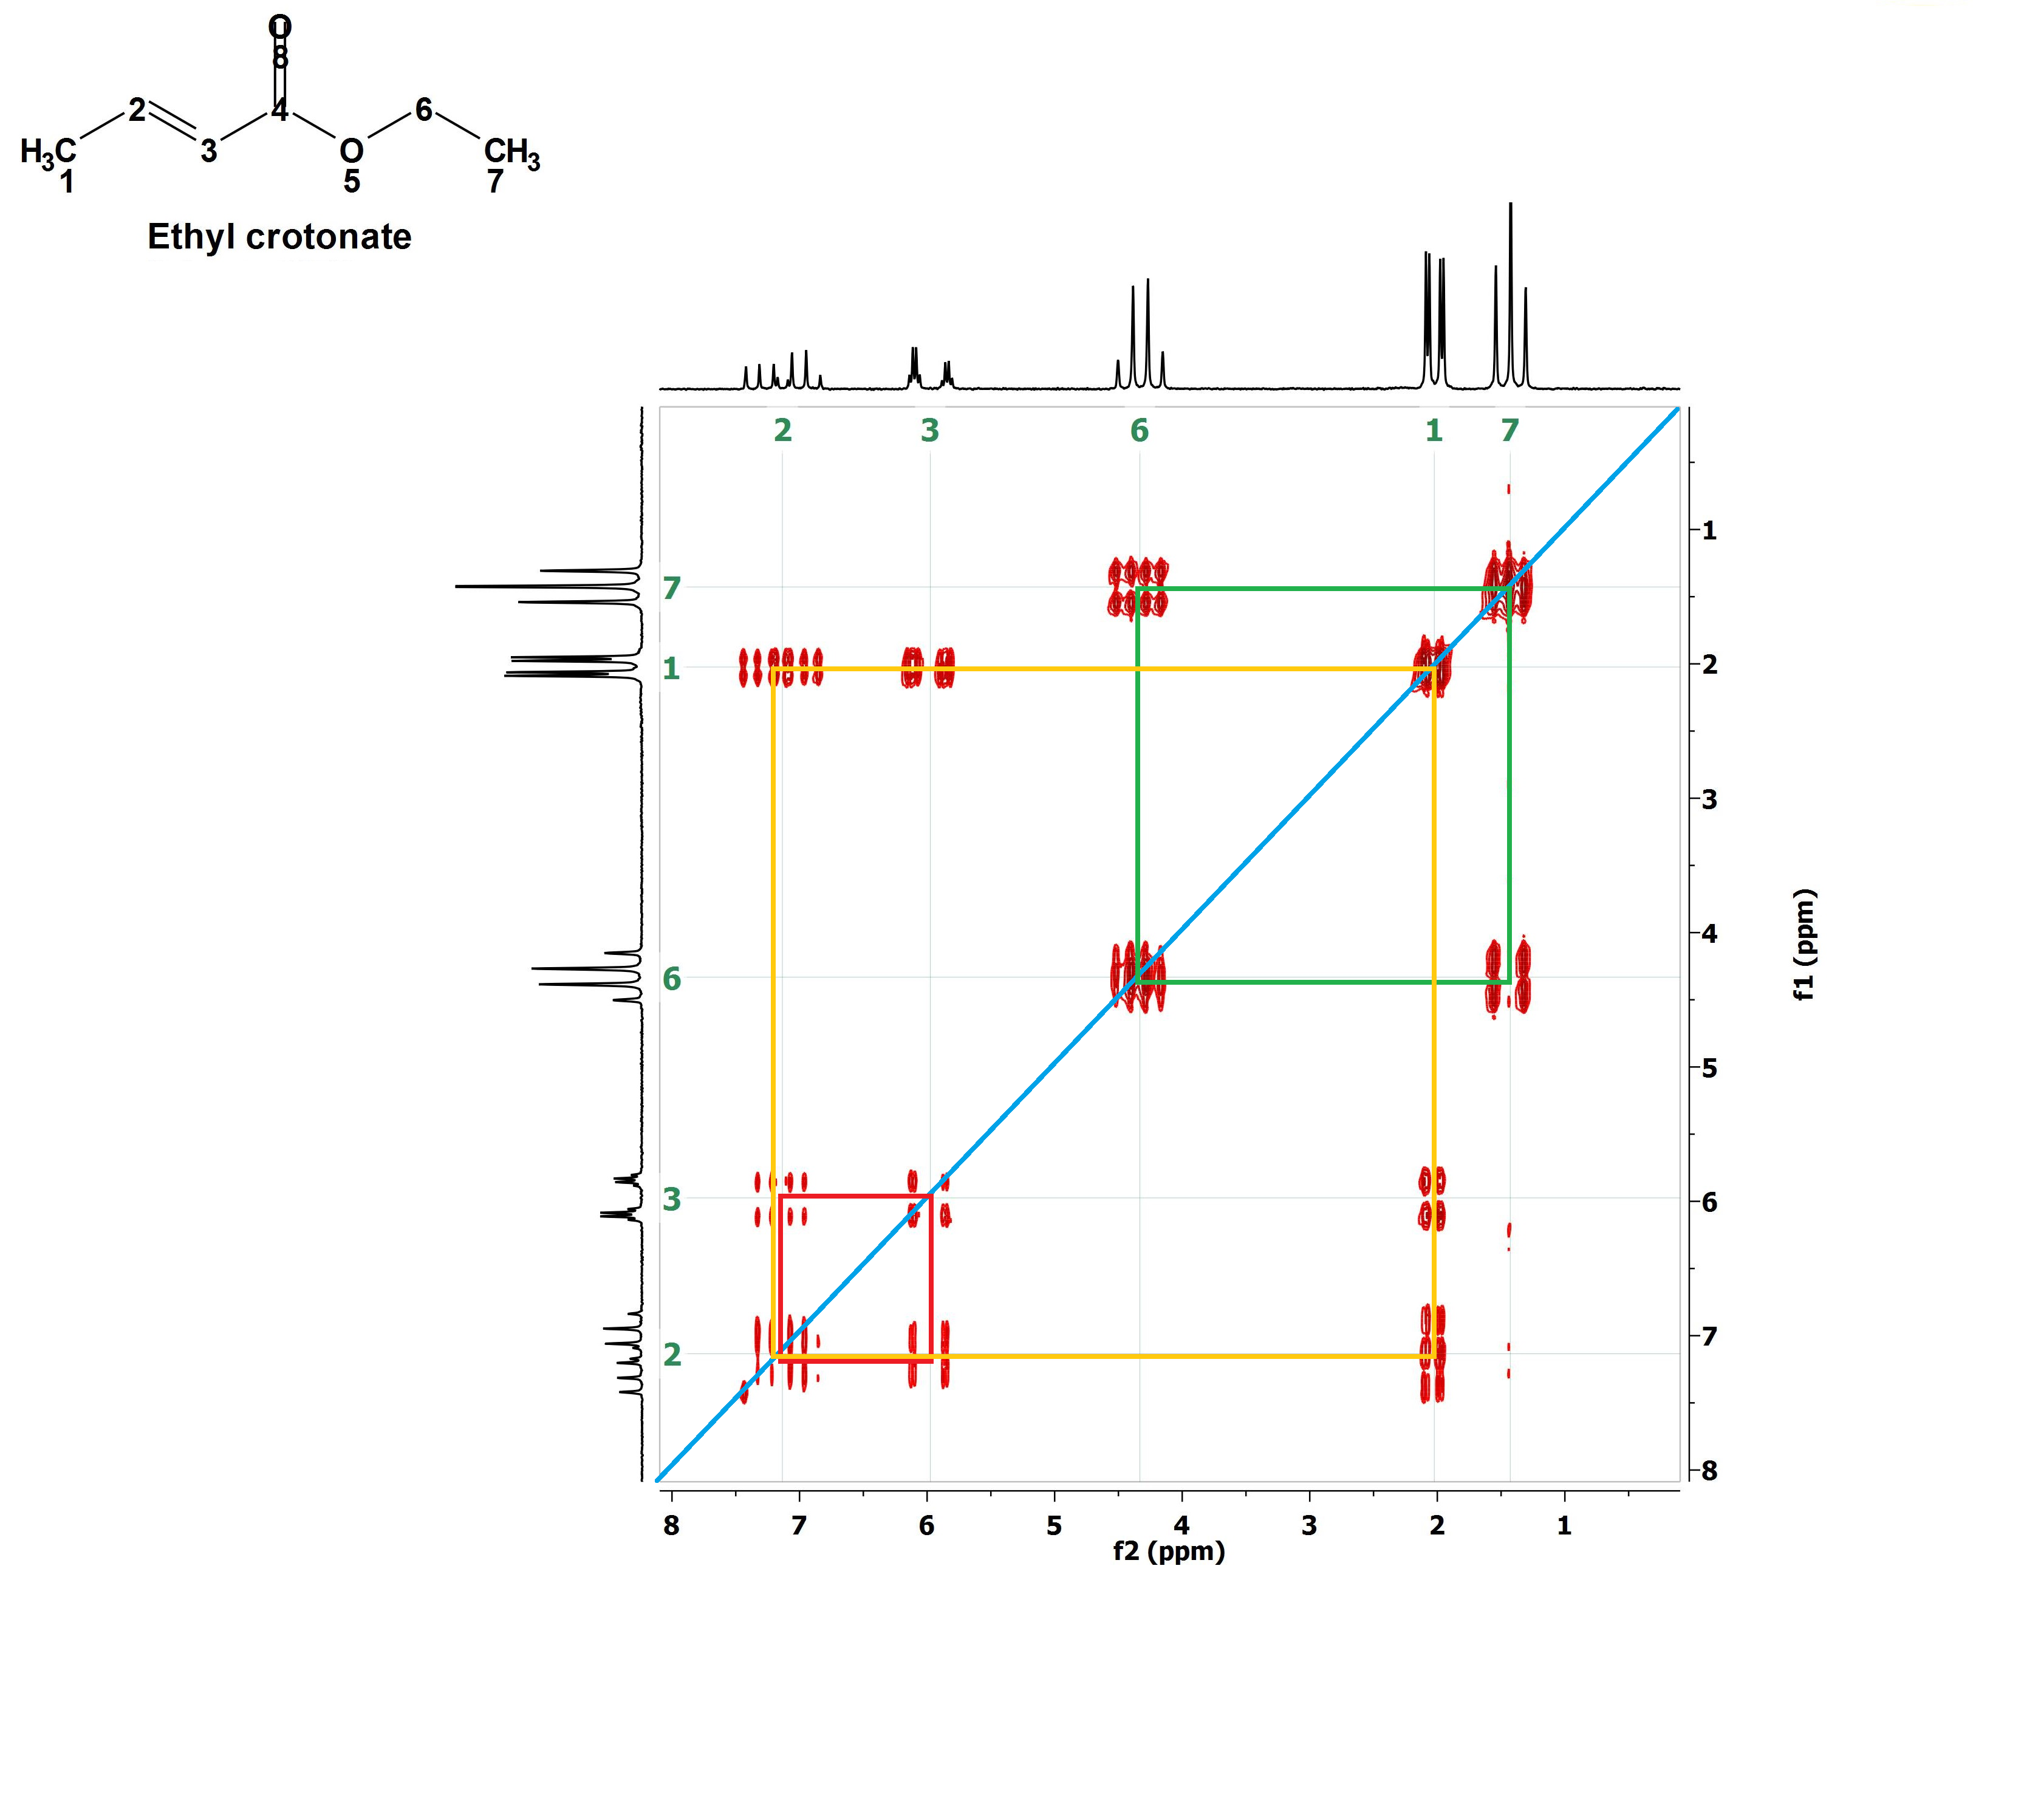
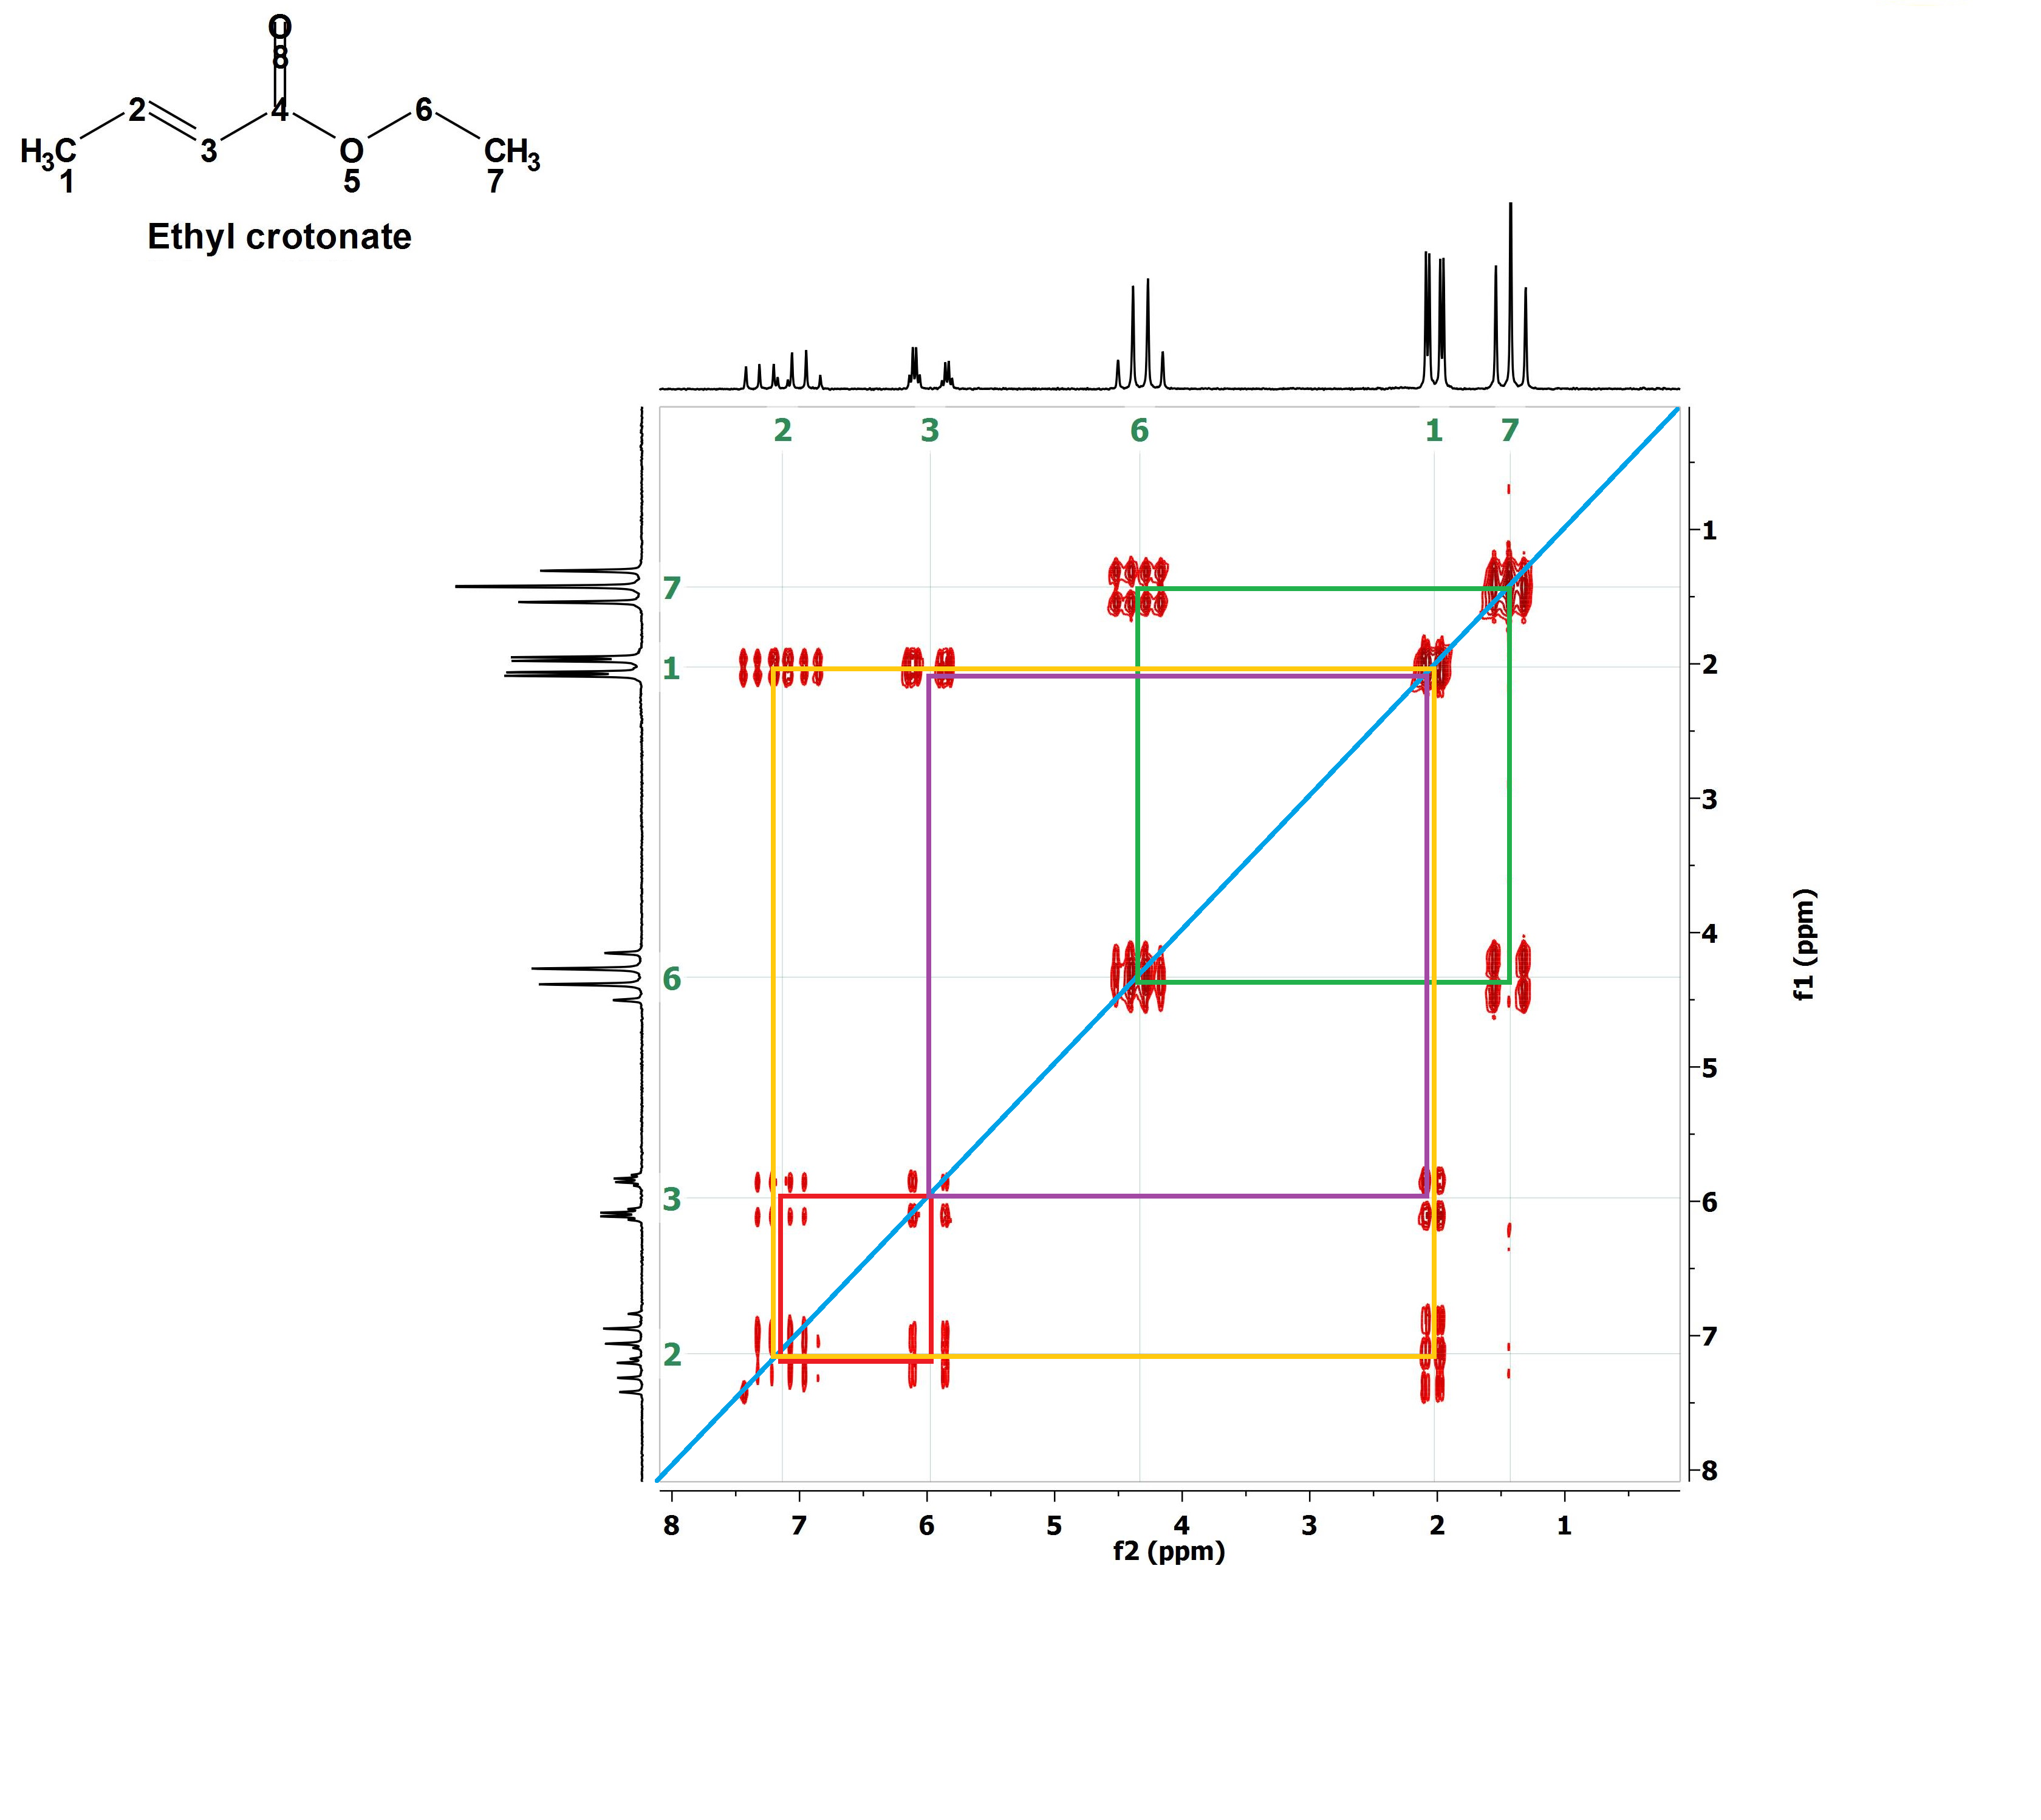
The 2D H/H COSY of ethyl crotonate.
We'll keep the compound structure close to the spectrum for the sake of your understanding. Of course, the usefulness of these spectra is the structure determination of unknown compounds but we cannot start building the house by the roof...
Make a list of your once-over observations:
1) There are kind of weird signals (in red) within a paralelogram.
2) In the upper and left sides of the paralelogram two conventional 1H-NMR spectra (in black) have been plotted.
3) The vertical and horizontal scales (ppm) are typical for 1H-NMR spectra.
4) The red weird signals are coincident with the signals of the conventional 1H-NMR spectra.
Before understanding the 2D spectrum, let's decipher the conventional 1H-NMR spectrum:
1) The signals at 1.5 ppm (triplet) and 4.4 ppm (quartet) belong to the CH3CH2 moiety. The multiplicities can be easily understood with the N+1 rule.
2) The signal at 2.0 ppm (double-doublet) belongs to the CH3 at the double bond.
3) This CH3 couples to both olefin's 1H's but with two different coupling constants because it is at different bond distances to each of them [C(1)H3-C(2)H-C(3); 3 bonds from HC(2) and 4 bonds from HC(3)].
4) The signals at 6 ppm and 7.2 ppm belong to the olefin's 1H's and they are very complex because these 1H's mutually couple and to the CH3 group too.
5) The latter signals are both "double-quartets", quartet because they couple to the CH3 group (N + 1 = 3+1) and doublet due to the mutual coupling with the other olefin's 1H
(N +1 = 1+1).
6) The four lines of each quartet of the signal at 6 ppm bear the smallest separation (lowest coupling constant) suggesting that it belongs to H(C3), the furthest from the C(1)H3 group.
We may now start deciphering the 2D H/H COSY:
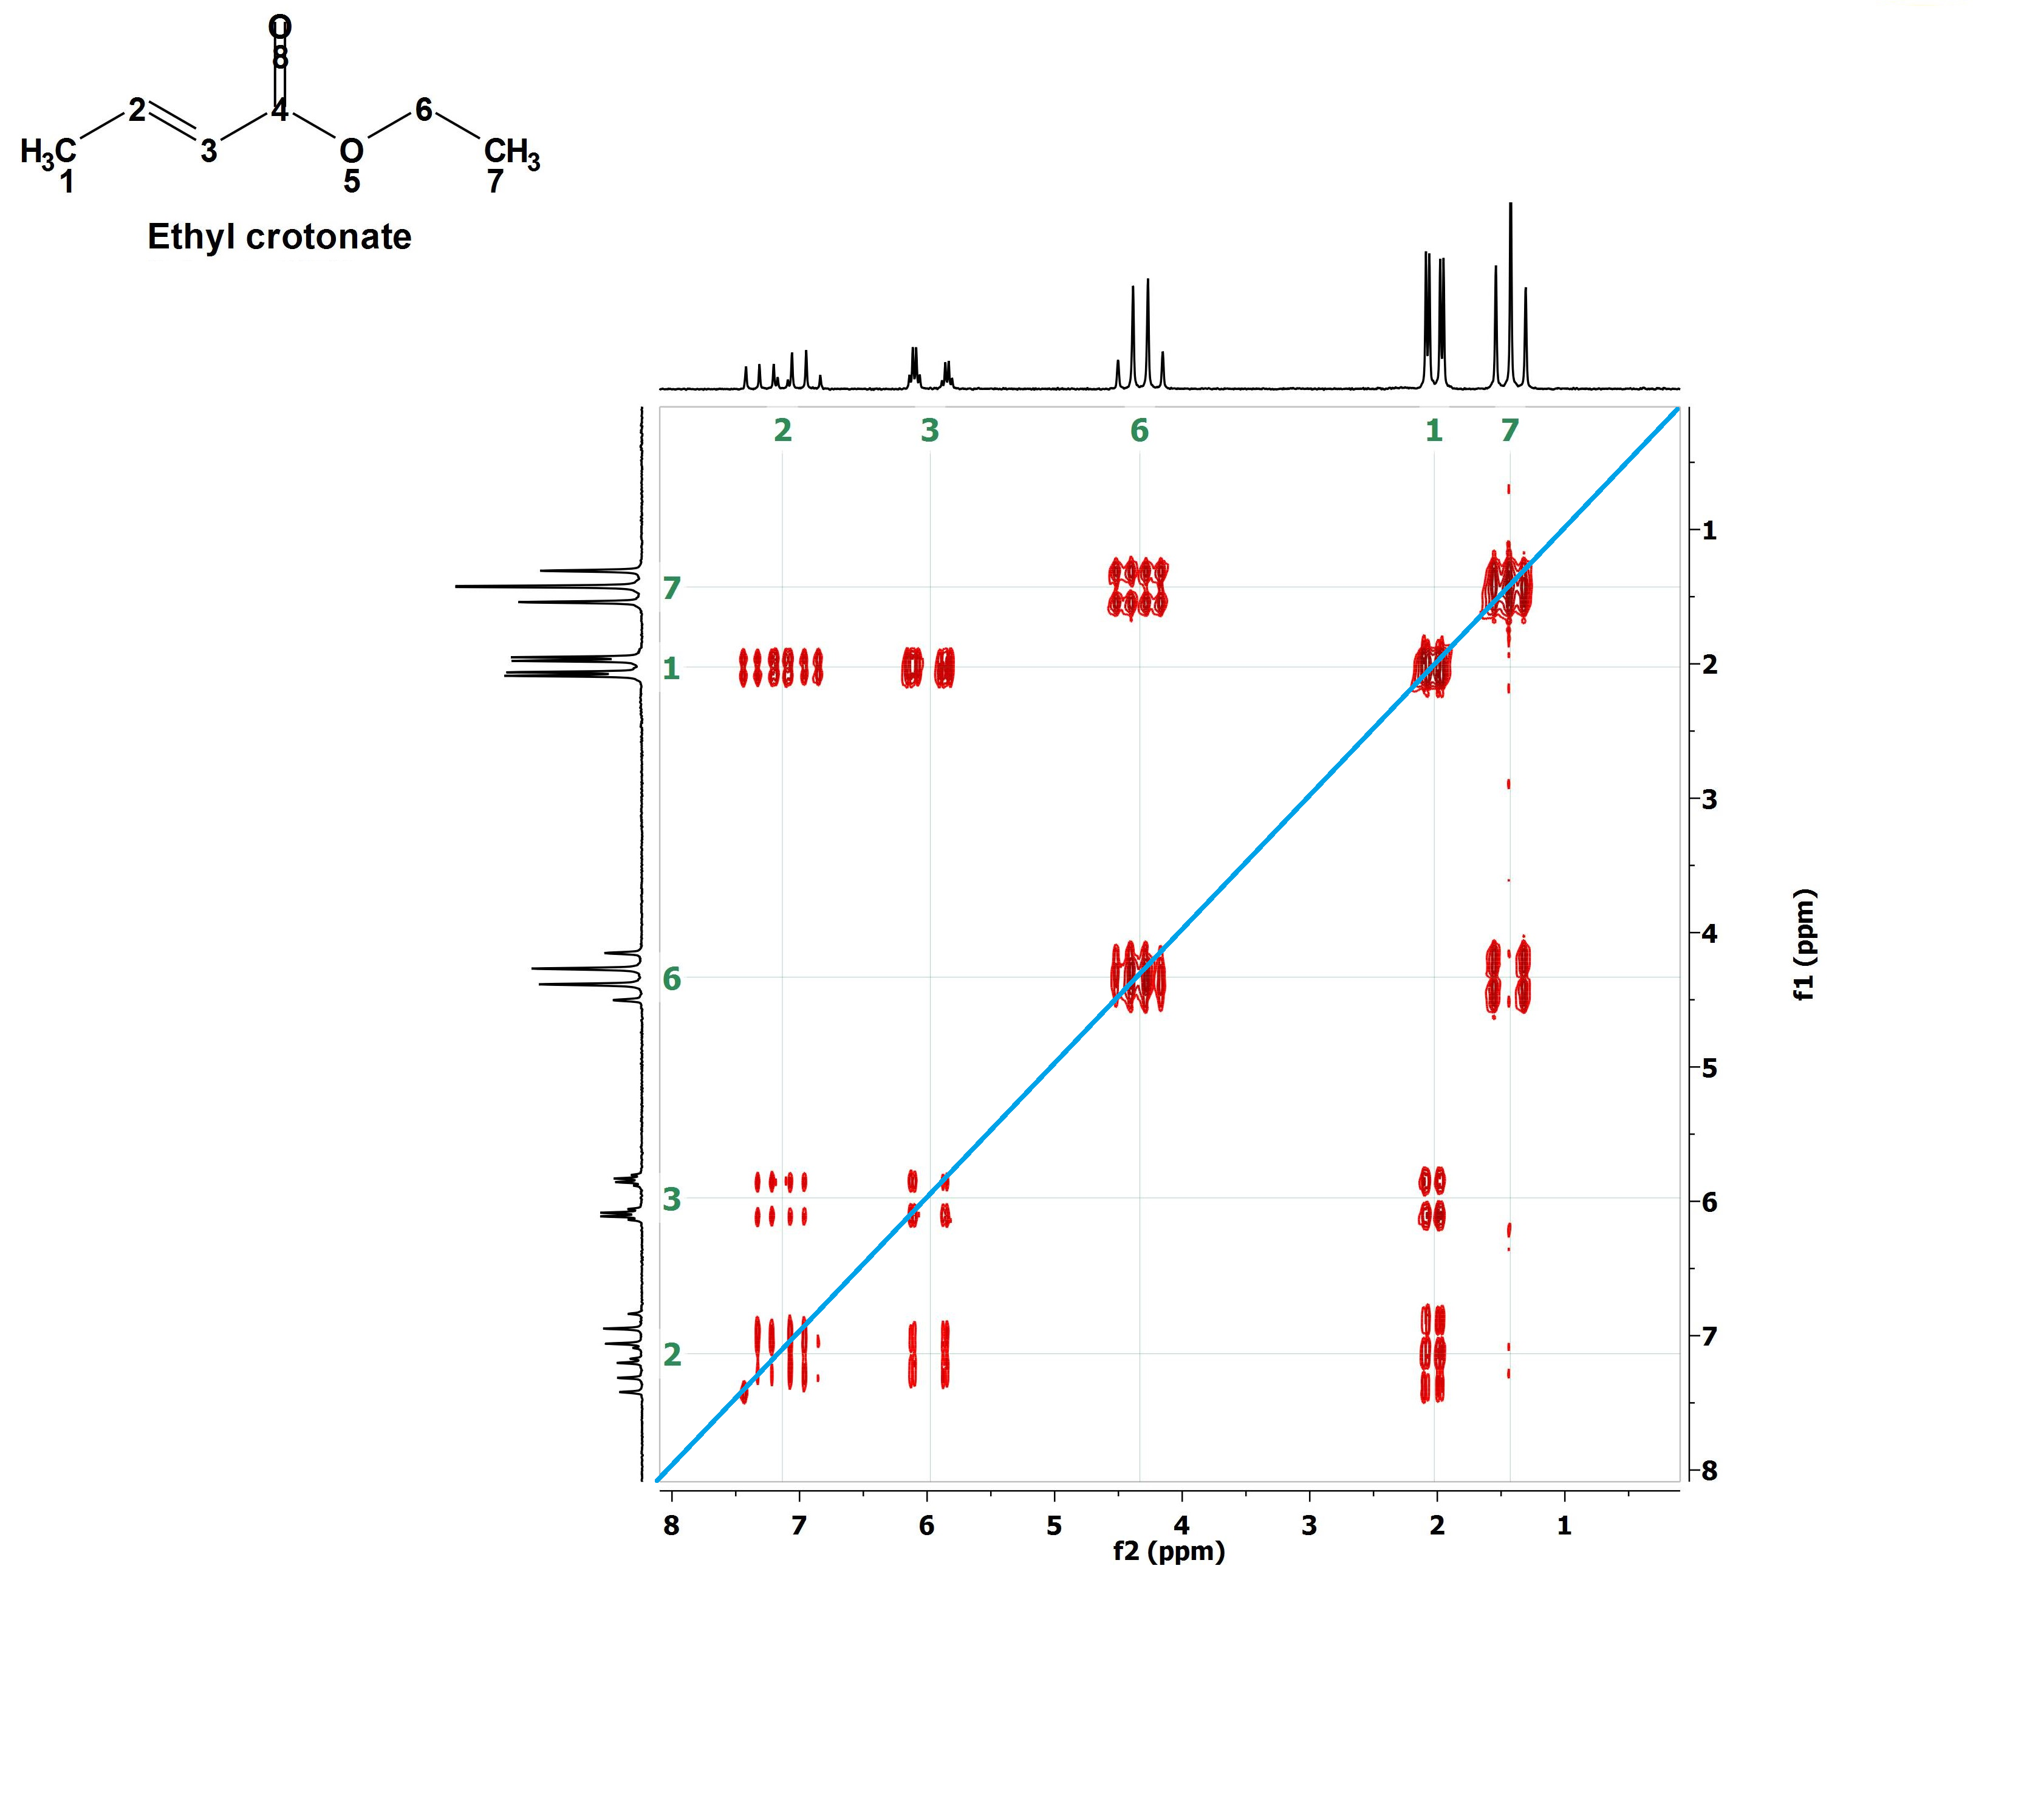
1) First of all, let's trace a diagonal line (in blue) joining the corners of maximum and minimum ppm values.
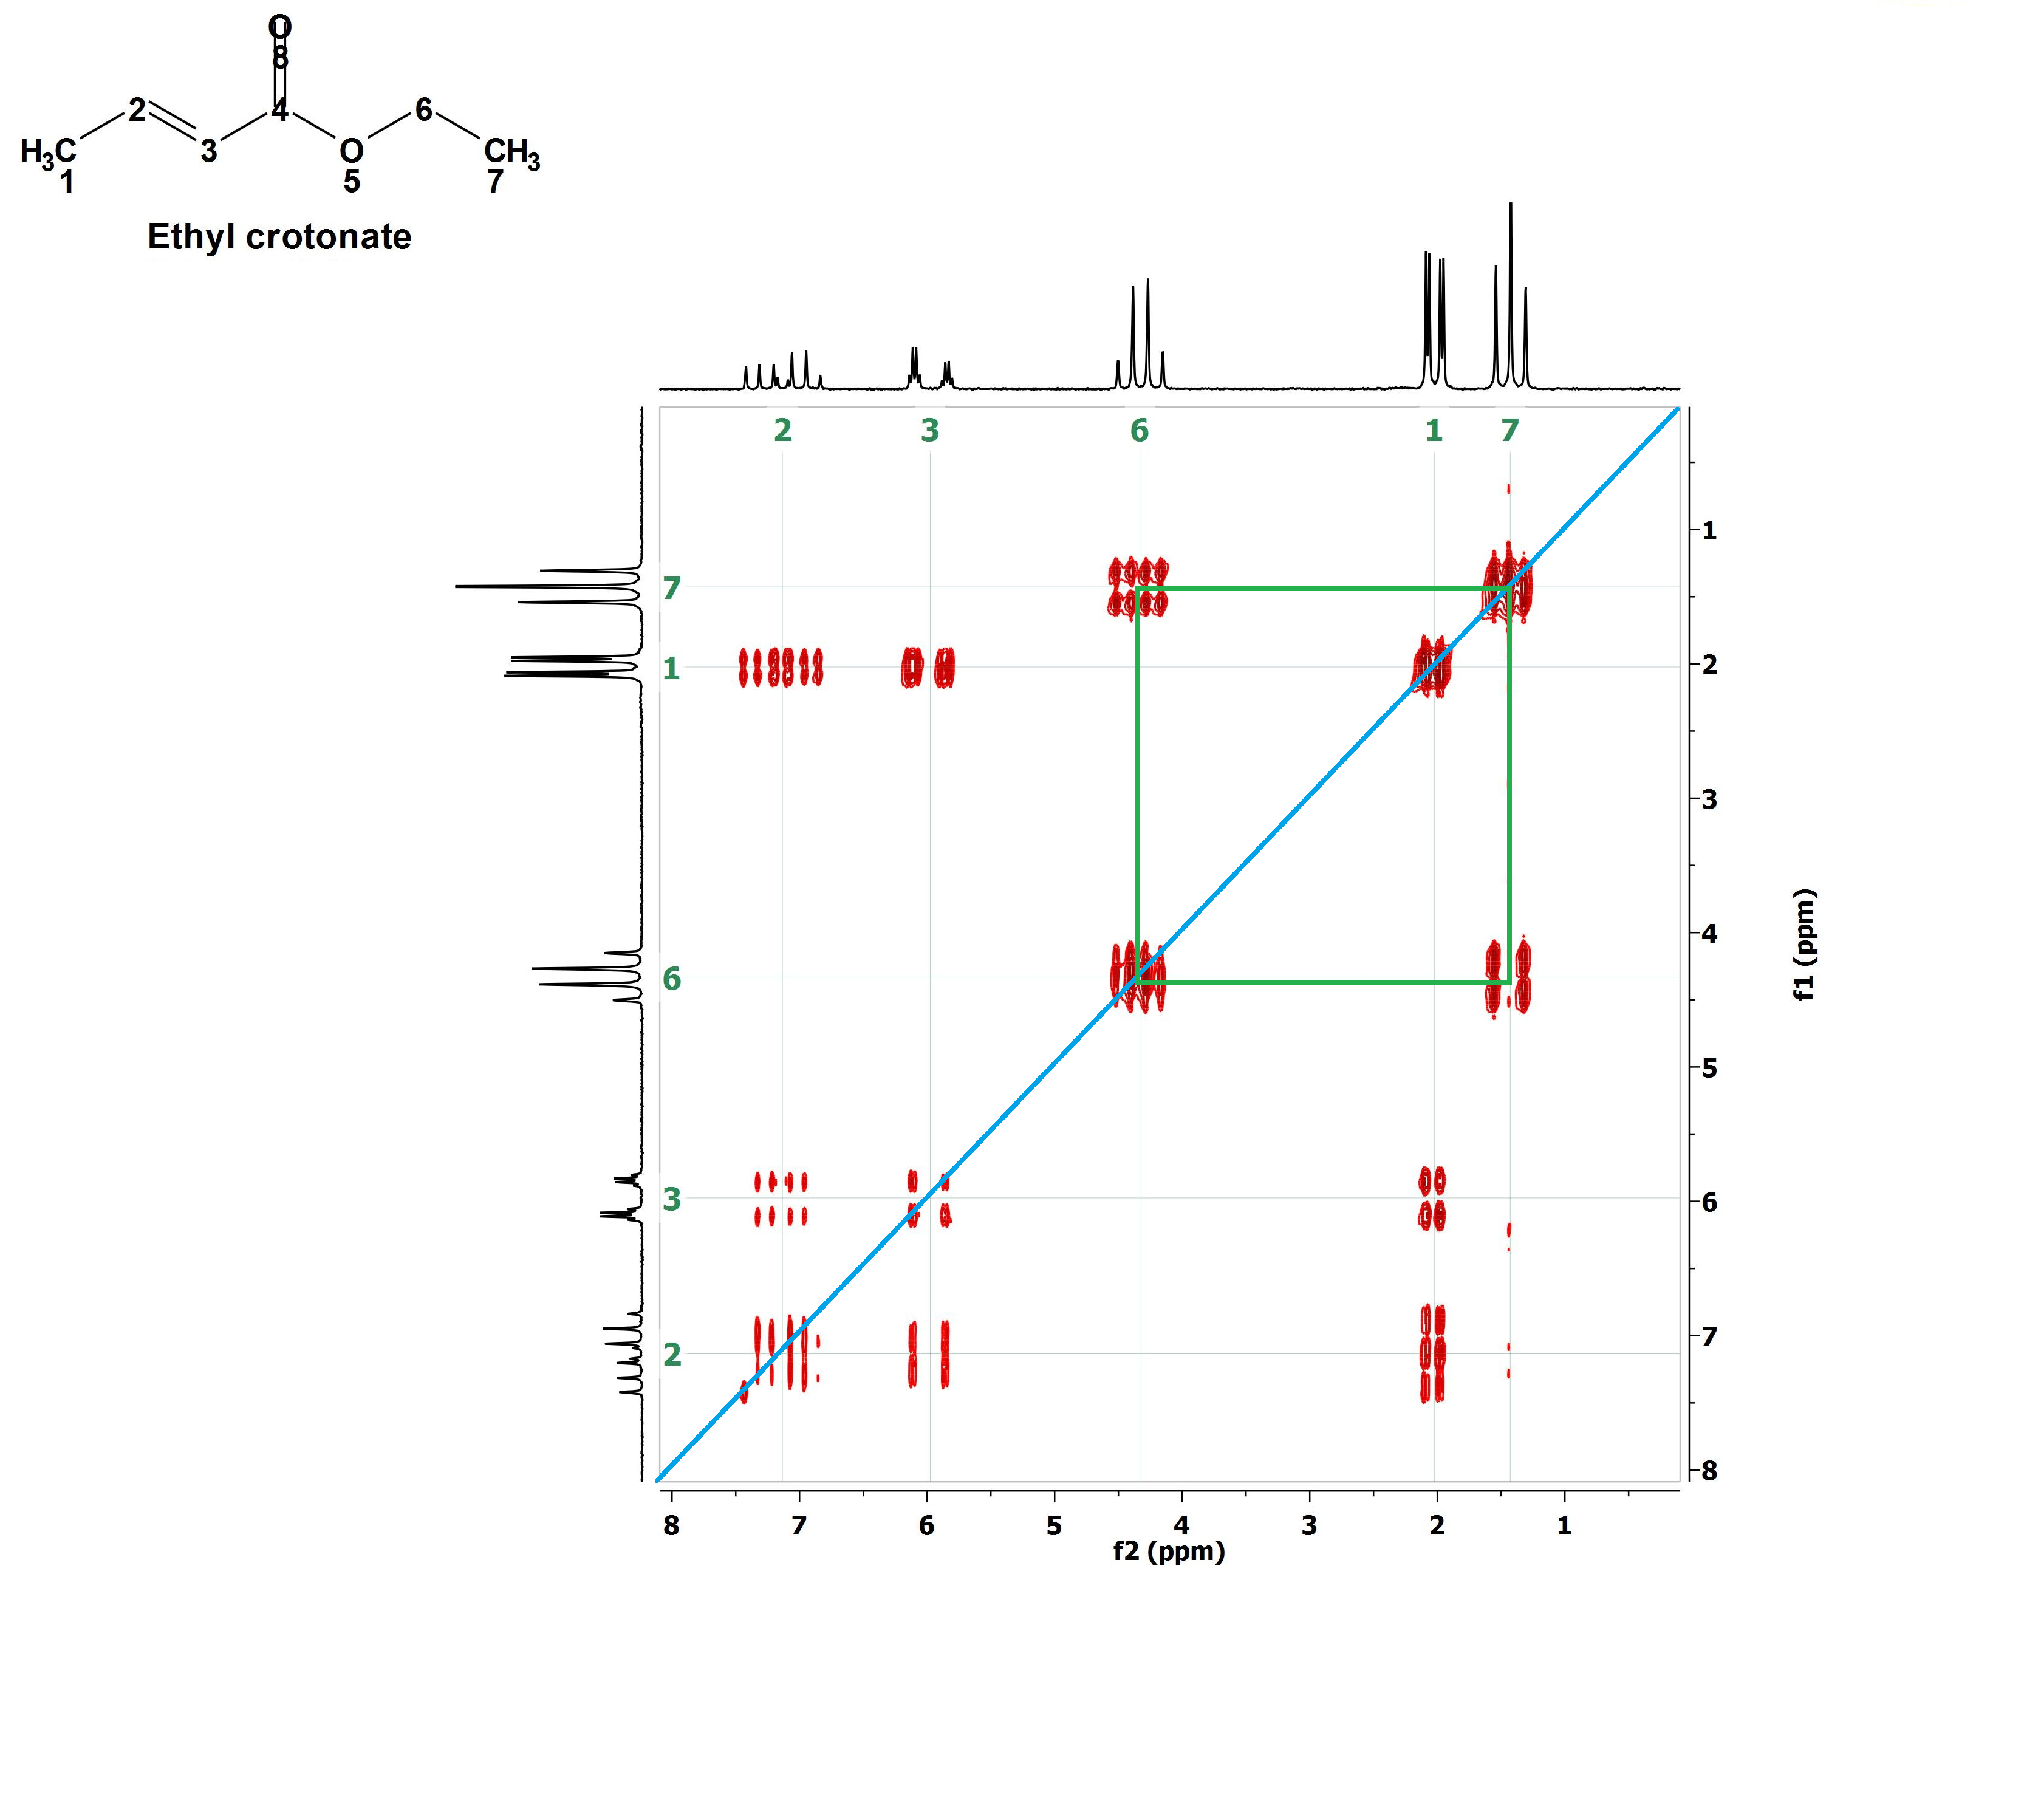
We do know before hand that the signals belonging to the CH3CH2 group are those at 1.5 ppm and 4.4 ppm.
They correlate by means of the drawn green paralelogram.
If two signals of a conventional 1H-NMR spectrum can be correlated in such that way in a 2D H/H COSY, it means that they belong to vicinal 1H's that are mutually coupled.
Are you able to draw more correlation paralelograms?
Of course you are!!!
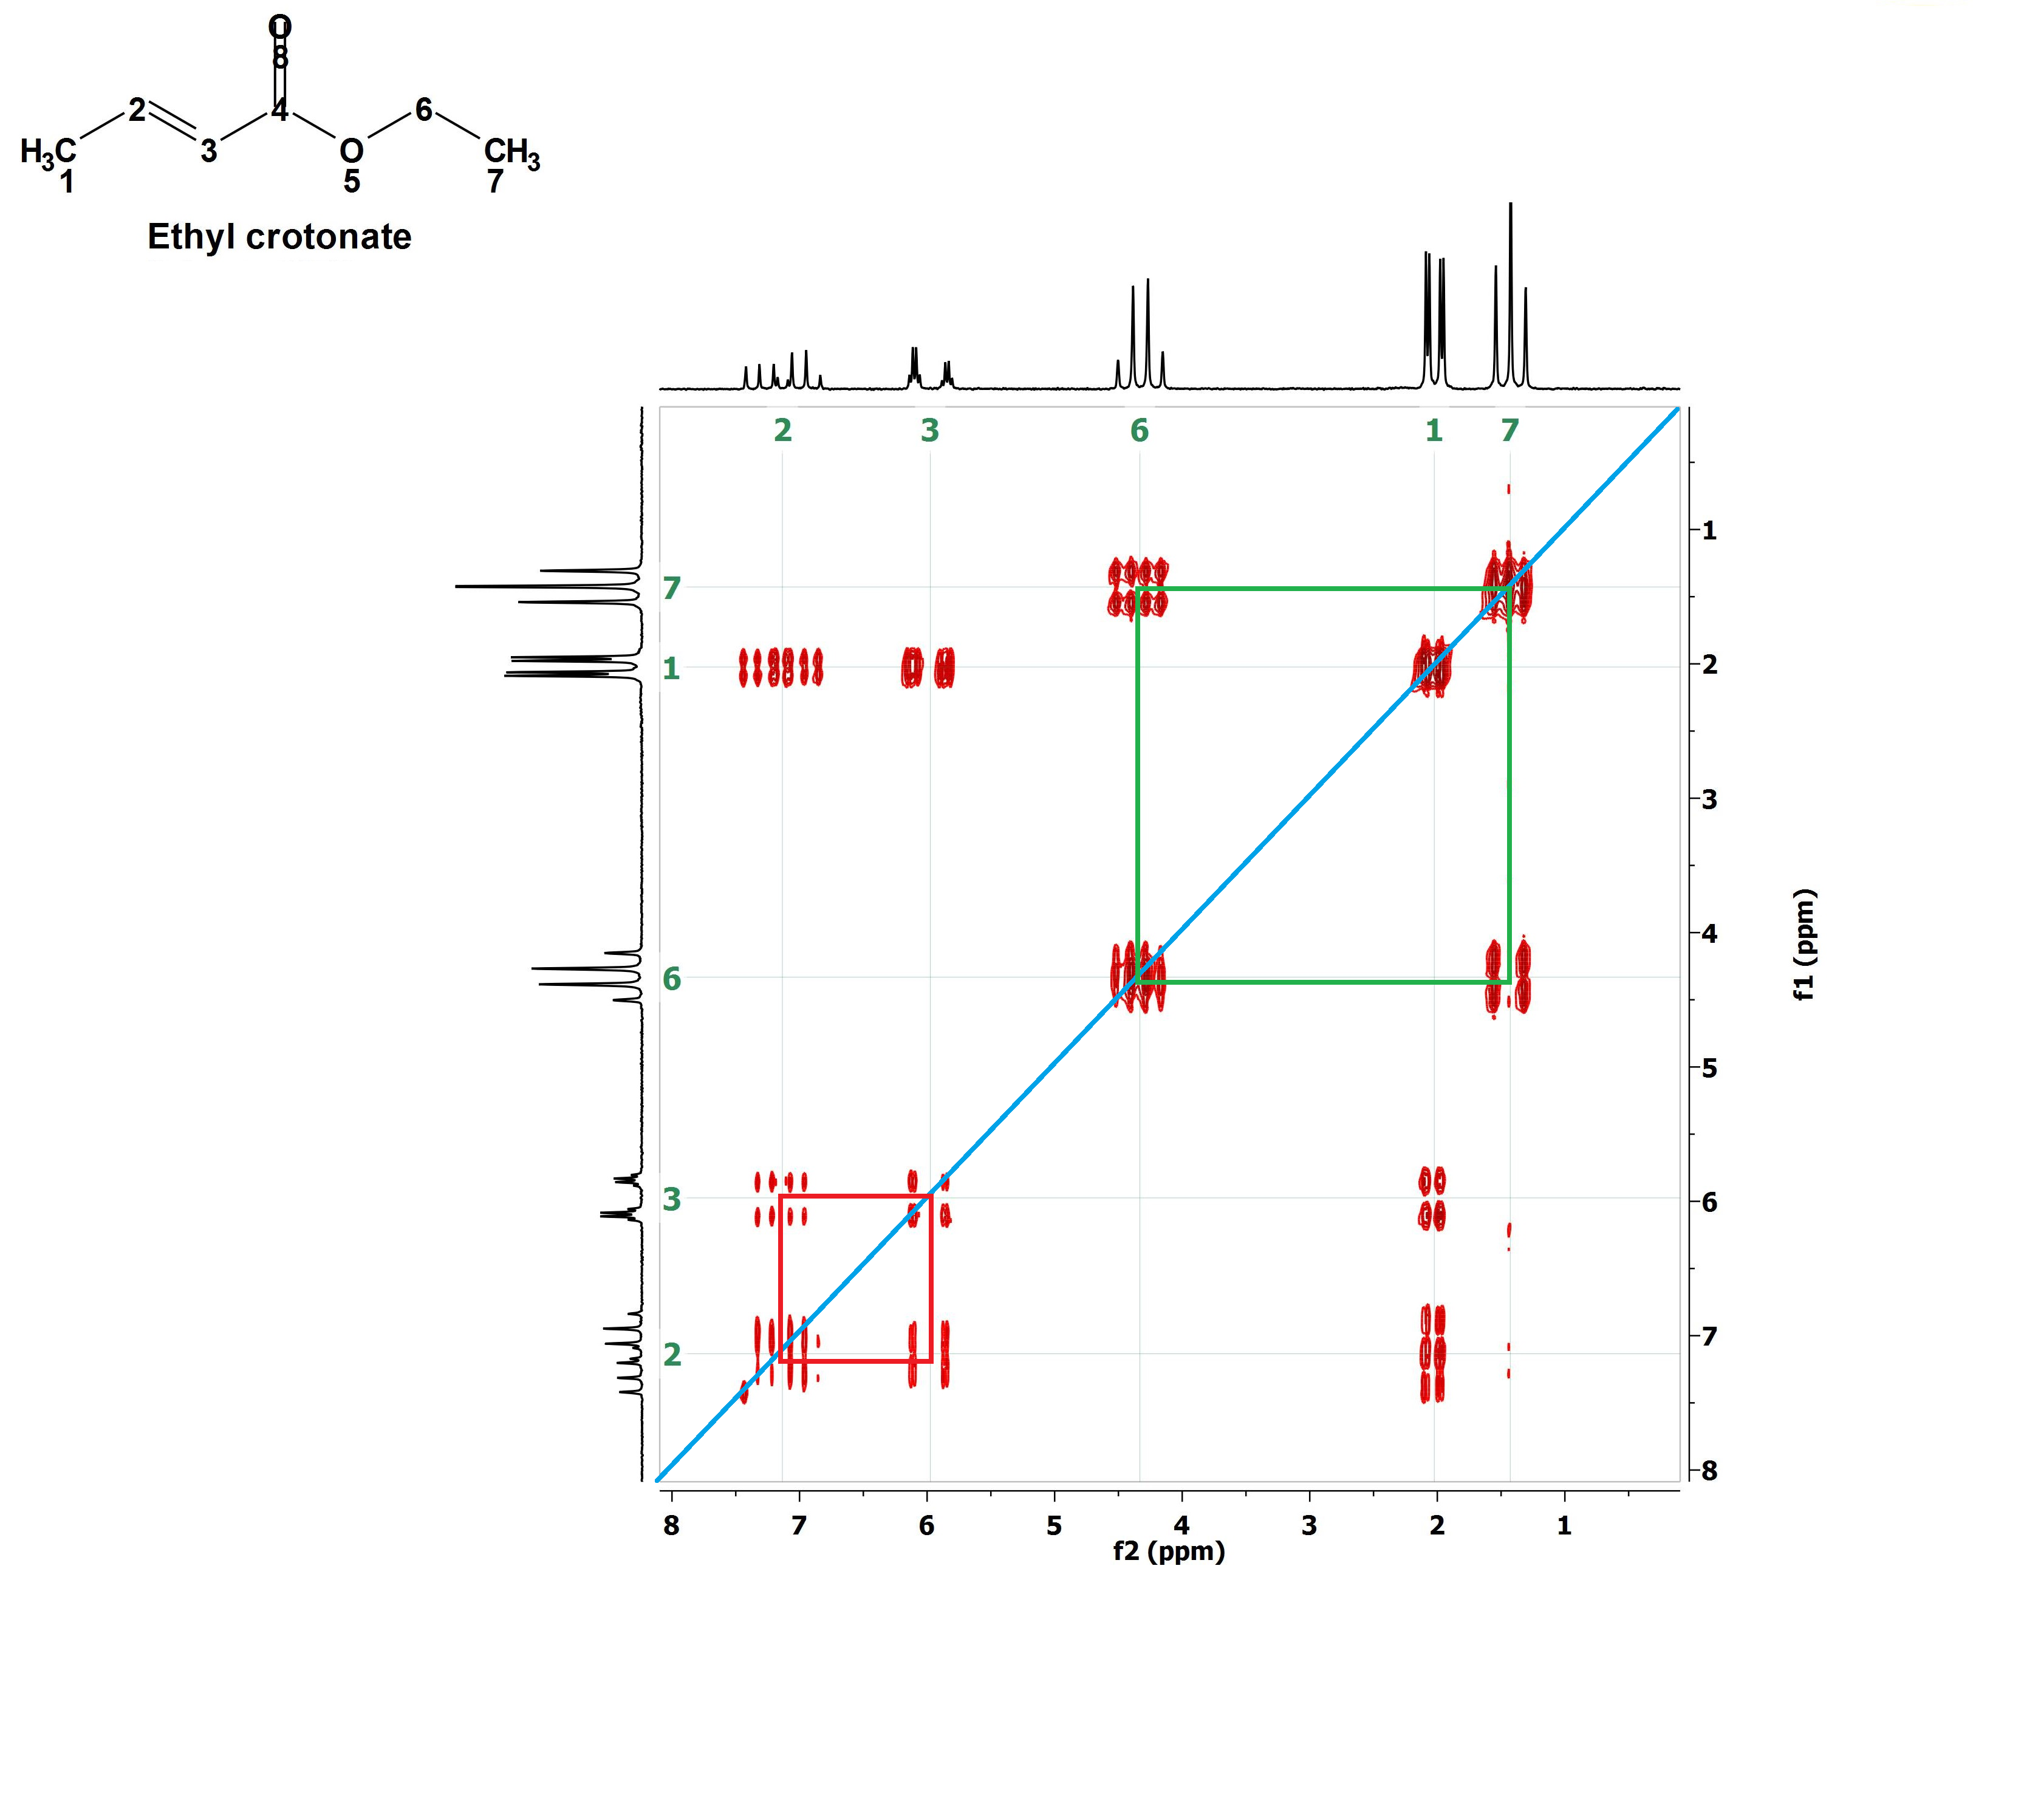
Let's outline them one by one. For instance the red one. With that the signals at 6 ppm and 7.2 ppm belonging to the olefin's 1H's are correlated meaning that these 1H's are vicinal and coupled.
Now the yellow paralelogram. What signals does it correlate? Those at 7.2 ppm and 2.0 ppm, i.e, one olefin's 1H vicinal to CH3 group's 1H's.
The mauve paralelogram correlates the other olefin's 1H (6 ppm) with the CH3 group's 1H's (2.0 ppm) that are vicinal neighbors at a longer distance.
Interpretation of a 2D H/H COSY knowing the structure before hand was easy, wasn't it?
Of course, it wouldn't be that easy when one studies a spectrum from an unknown structure. We'll see various examples...
