FACT REVIEW AND ADDITIONAL FEATURES
I'd like to make you aware of the fact that NMR is quite complex a technique to master and its spectra are sometimes very intricate and difficult to interpret.
In this course we are far from explaining everything but we'll provide you with enough experience in order to be way above the average person concerning structure determination.
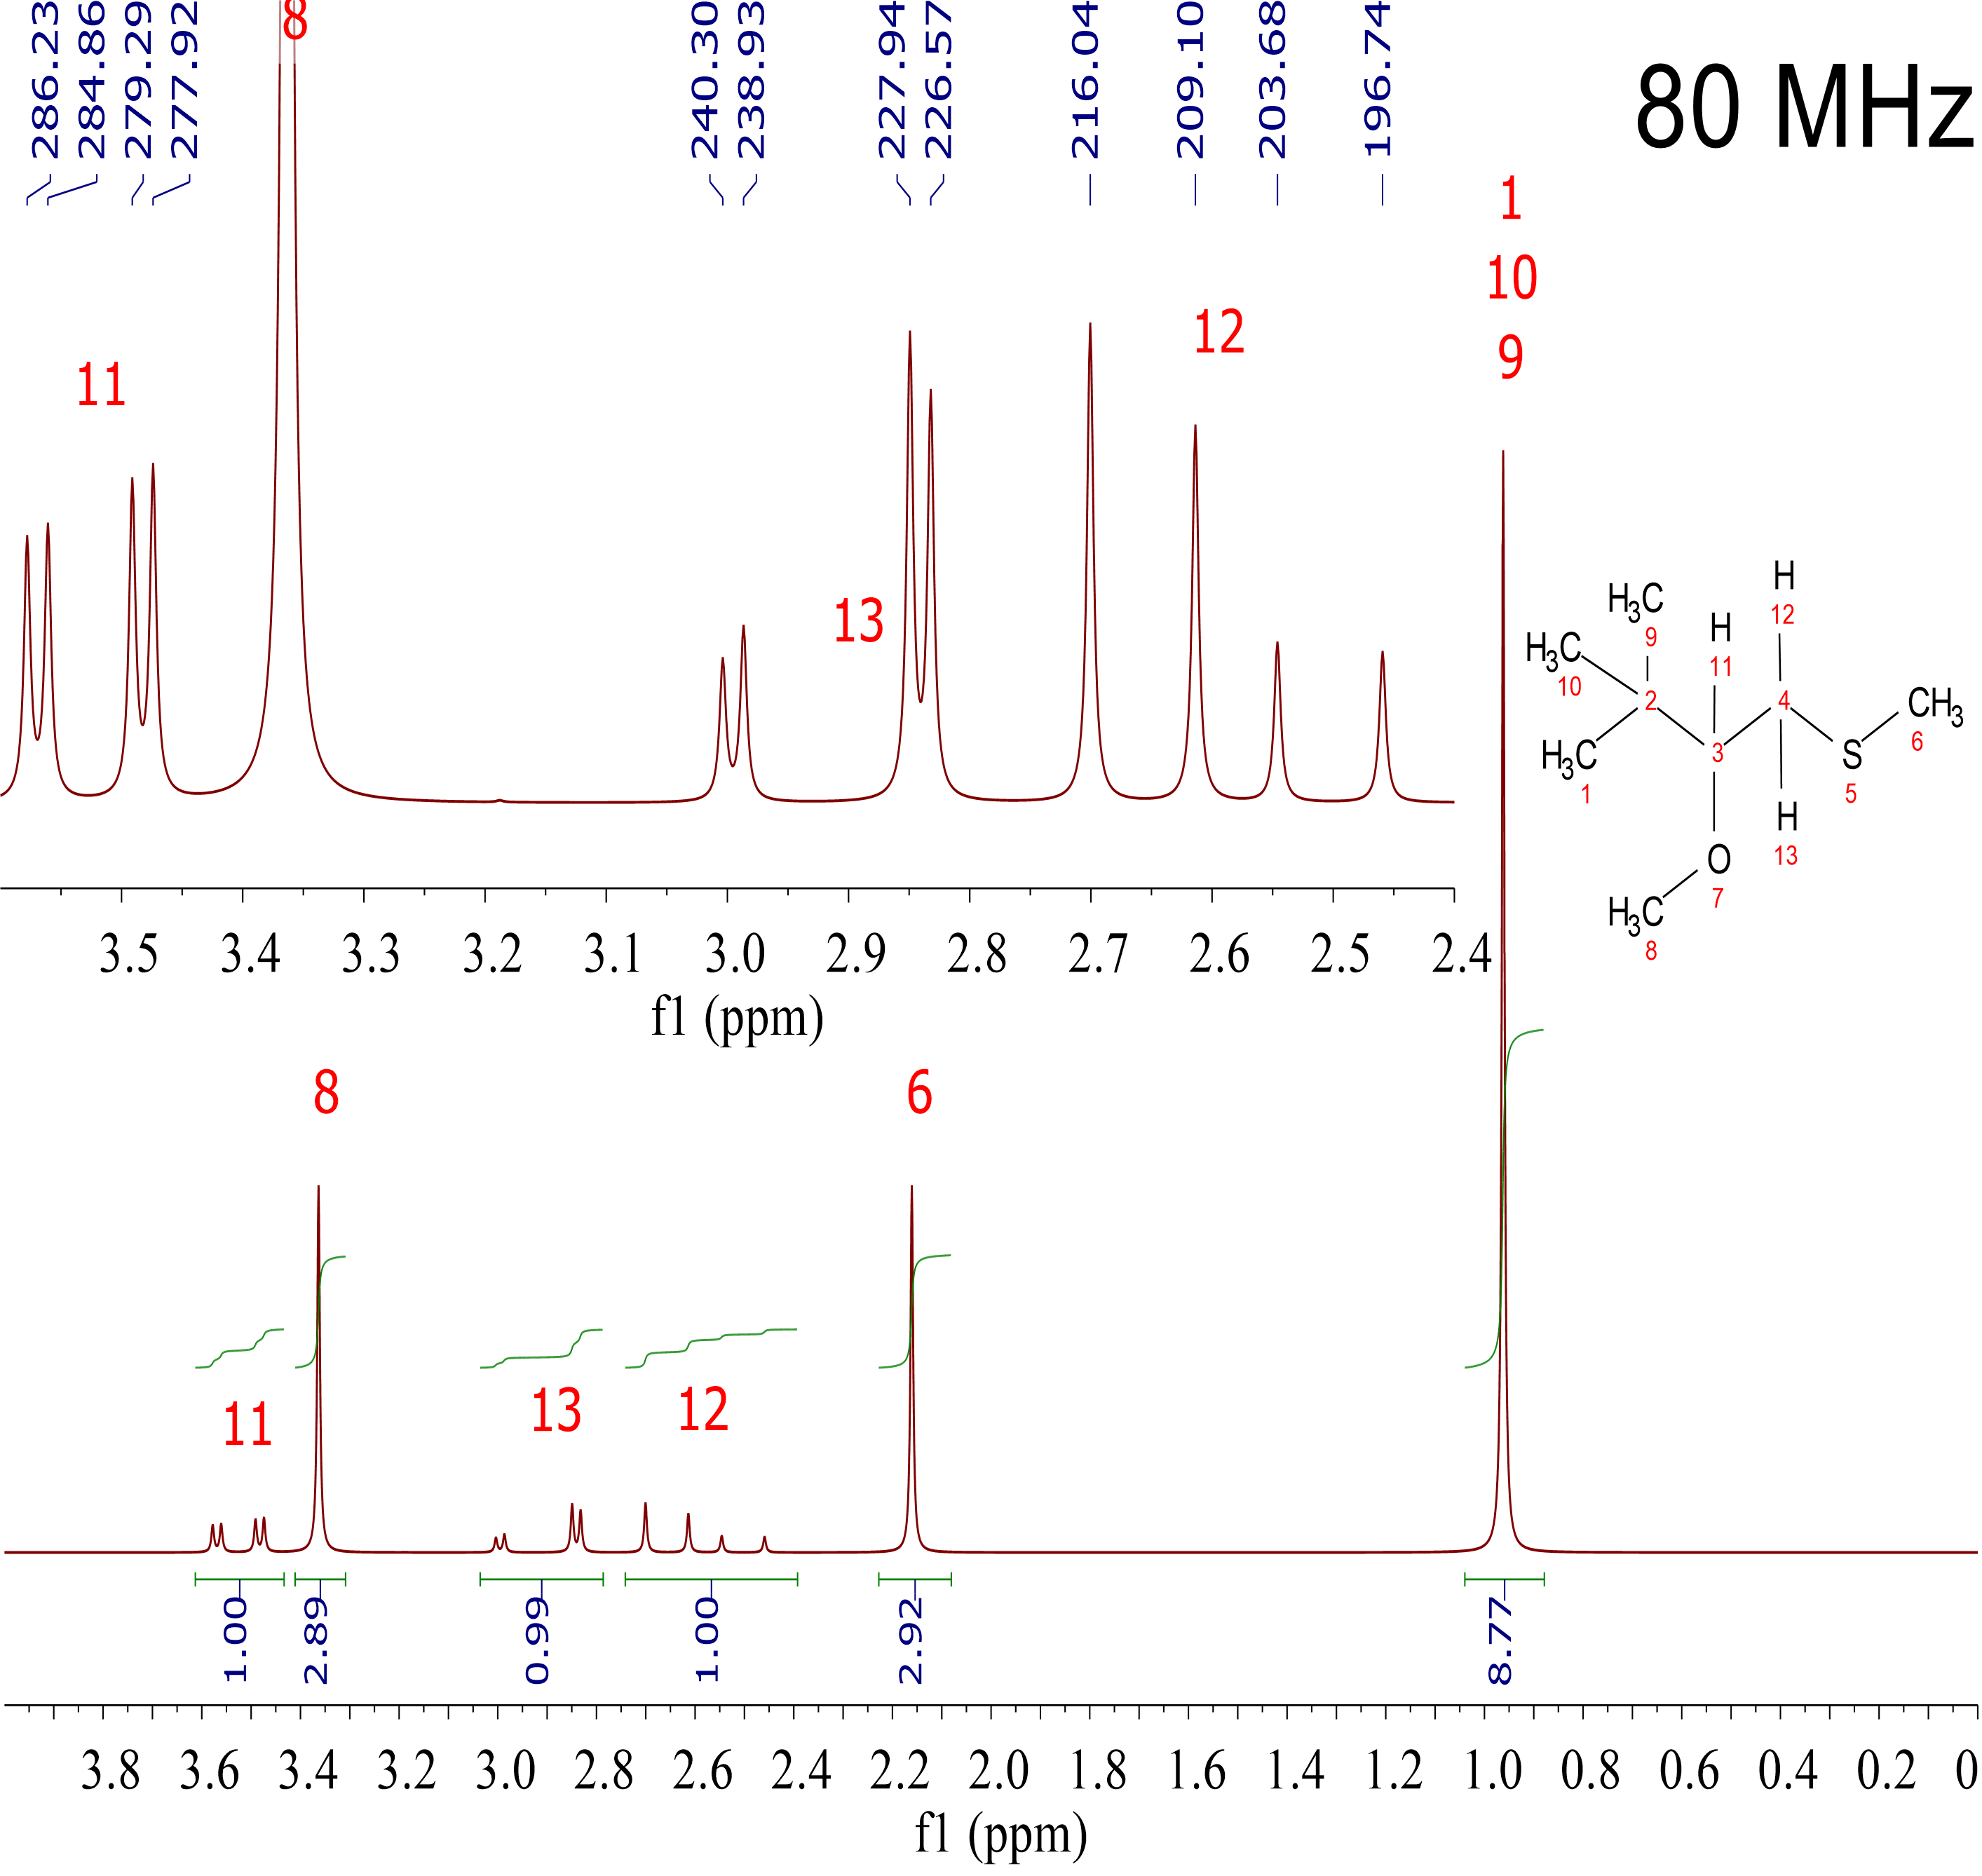
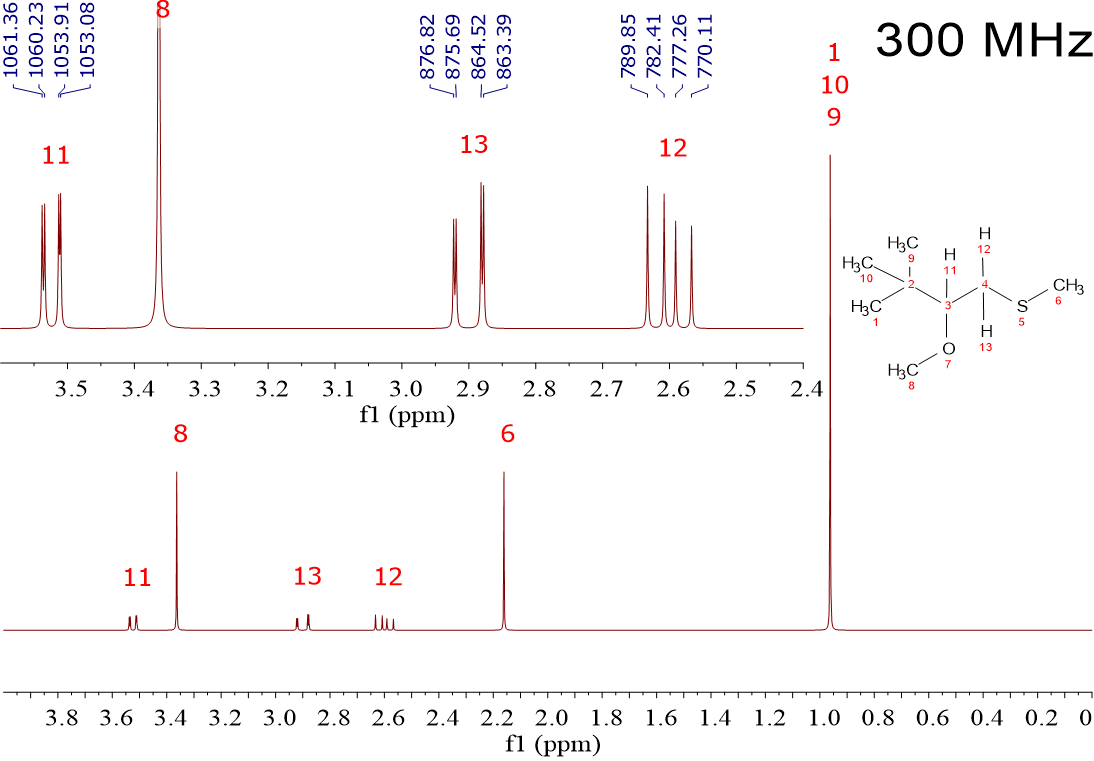
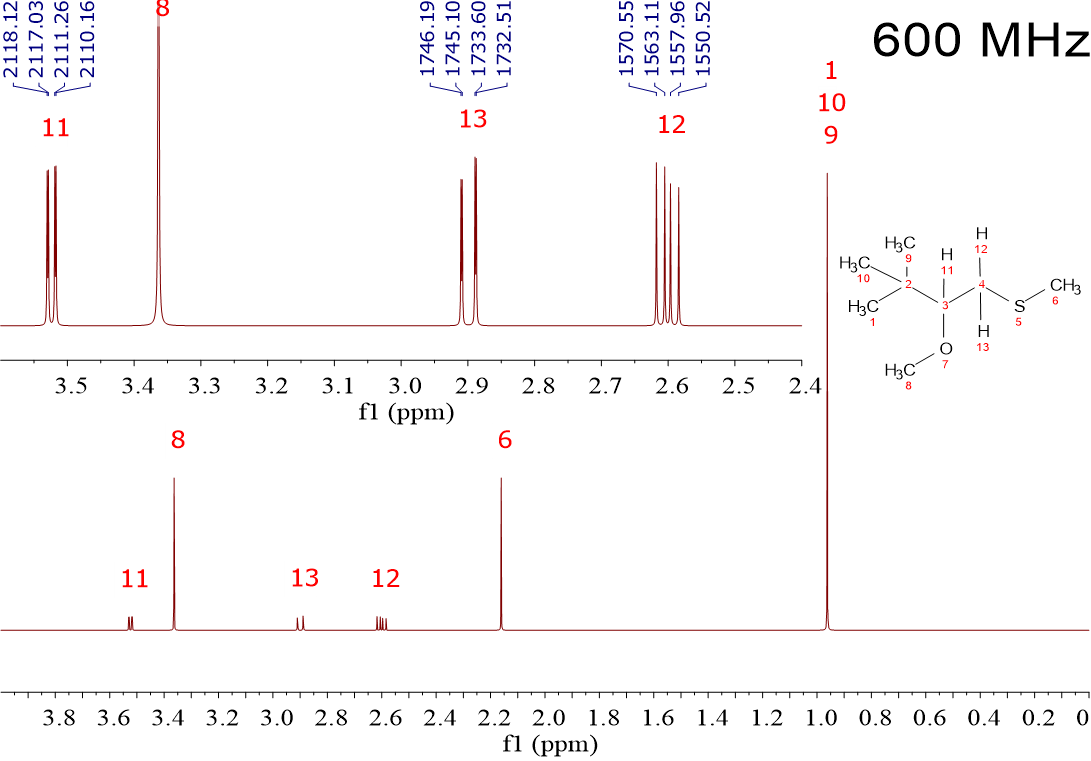
I want you now to compare the three following spectra recorded from the very same sample but in three different NMR instruments, of 80 MHz, 300 MHz and 600 MHz.
Those equipments are of increasing power, with increasing strength of their magnetic fields (1.8, 6.9 and 13.8 Tesla), the 1H's resonating at 80, 300 and 600 MHz, respectively.
What similarities and differences can you see among the three of them?
Let's begin by the similarities:
1) The three spectra contain three singlets and three multiplets.
2) The three singlets' chemical shifts are respectively identical in the three spectra. (0.95 ppm, 2.15 ppm and 3.35 ppm).
3) The chemical shifts of the centers of each multiplet are also identical [2.6 ppm for H(12), 2.9 ppm for H(13) and 3.52 ppm for H(11)].
4) "Leg" separation in the multiplets is very similar. For instance, in H[13] we measure 1.37 Hz and 12.36 Hz in the 80 MHz spectrum; 1.13 Hz and 12.30 Hz in the 300 MHz spectrum; and 1.09 Hz y 12.59 Hz in the 600 MHz spectrum.
Let's unfold the differences:
1. Spectrum looking seems to be different. It's like signals are narrower when going from 80 MHz to 300 MHz and to 600 MHz instruments
2. "Leg" frequencies in Hz are different depending on the spectrometer.
3. "Leg" heights are quite different. In the 80 MHz instrument the flanking "legs" of H(12) y H(13) are much less intense than the internal ones. That effect is less visible in the 300 MHz instrument and even less in the 600 MHz spectrometer.
These observations lead to the following conclusions:
1. The number of signals of a given compound in 1H-NMR and their chemical shift are independent from the working frequency of the spectrometer, i.e. from the magnet strenght.
2. The width in Hz of one ppm is different from one spectrometer to the next. One ppm in the 80 MHz instrument spans 80 Hz, but 300 Hz in the 300 MHz spectrometer and 600 Hz in the 600 Hz instrument.
3. The higher the working frequency of the instrument, the narrower the signals look like.
Believe it or not, the "leg" width (measured at half-height) is the very same in the three spectra (0.5 Hz).
This width means 0.6% of the 80 Hz a ppm spans in the 80 MHz instrument whereas is only 0.17 and 0.08% in the 300 and 600 MHz spectrometers.
Therefore, the higher the working frequency of the instrument, the larger the room in Hz to place signals and the narrower the signals look like.
4. The frequency of the signals in Hz is spectrometer dependent.
For example, the average of the four legs of the double-doublet of H[13] is at ca. 205 Hz, 705 Hz and 1560 Hz in the 80 MHz, 300 Mhz and 600 MHz instruments, respectively.
However, if we devide each of the three chemical shifts in Hz by the working frequency of each instrument, we end up with the very same chemical shif in ppm (2.6 ppm).
5. The chemical shift separation in ppm among the different signals is spectrometer independent.
6. The chemical shift separation in Hz among the different signals is spectrometer dependent.
For instance, the center of the multiplets of the “double-doublets” of H(12) y H(13) are 25 Hz, 90 Hz or 190 Hz apart in the 80 MHz, 300 MHz and 600 MHz, repectively.
7. The chemical shift separation in Hz between the signals of 1H's that influence one another heavily affect their looking.
The lower the separtion in Hz, the higher the deformities.
That's the reason why the "legs" of the double-doublets of H(12) and H(13) are more different in height in the 80 MHz instrument, where the chemical shift difference (ca. 25 Hz) is similar to the observed "leg" separations (1.37 Hz, 6.96 Hz and 12.36 Hz).
These deformities are called “second-order effects".
8. The high-field NMR instruments, like the 600 MHz shown, render spectra practically free of "deformities or second-order effects" because they allow larger separations between the coupled 1H's.
For instance, the distance in Hz between H(12) and H(13) is ca. 190 Hz, a value two or three orders of magnitude higher than the separations observed among their "legs" (1.09 Hz, 6.44 Hz y 12.59 Hz).
Sorry for the joke: as it happens with cars, it's not the same driving a high-class or a utility vehicle. Nevertheless, you'll reach the same destination.
The high-field NMR instruments render high-quality spectra but they are pricey (a 600 MHz spectrometer can skyrocket to more than one million dollars and a costly maintaince).
A benchtop NMR instrument of 80 MHz renders quite decent spectra at a small fraction of that cost (50.000 to 100.000 dollars and no maintainance). However, one must be aware of the possible spectra deformities or second-order effects.
Last but not least, let me just mention that sensitivity also depends on the magnet strength. A powerful instrument like that working at 600 MHz allows you to record solutions below the mg scale of analyte whereas in the 80 MHz benchtop as much as 50 times that amount is usually needed.